The European Union’s adoption of renewable hydrogen, key to its sustainable energy transition, marks a pivotal change in its energy policy. In accordance with EU goals to enhance renewable energy usage and reduce carbon emissions, the European Commission adopted on 10 February 2023 two Delegated Acts supplementing the renewable energy Directive (EU) 2018/2001. The first Delegated Act sets out detailed rules for the production of renewable liquid and gaseous transport fuels of non-biological origin (RFNBO). The second Delegated Act sets out a methodology for calculating lifecycle greenhouse gas emissions savings from renewable fuels of non-biological origin (RFNBO).
The new rules will ensure that hydrogen and associated fuels are only counted as renewable if they lead to emissions savings of at least 70%. Moreover, they will need to be produced using additional renewable electricity (additionality criteria) generated at the same time (temporal correlation criteria) and in the same area (geographical correlation criteria) as their own production. The rules will be phased in gradually and become more stringent over time as renewable hydrogen production is scaled up.
The temporal correlation criteria, when considered alongside the intermittent character of renewable electricity sources (RES), increases the need for intelligent power sourcing and the careful sizing of renewable installations. The present analysis aims at studying the impact of the different renewable electricity sources production profiles, the temporal correlation criteria and the grid emissions factor on the optimal renewable installation sizing in the case of a mix of fully renewable and grid electricity.
Assumptions
The RES examined include solar, onshore wind, offshore wind, as well as combinations of solar with onshore wind, and solar with offshore wind. In cases involving combinations, a “solar production ratio” is established, representing the ratio of renewable electricity production contracted through a power purchase agreement (PPA) that is derived from solar sources.
In the analysis presented below, the term “power production to consumption ratio” refers to the comparison between the total amount of renewable electricity generated by the RES contracted through a PPA and the electricity used by the electrolyser. Any shortfall between production and consumption is supplemented by grid electricity.
As per EU Commission’s Methodology Delegated Act, the fossil fuel comparator for renewable liquid and gaseous transport fuels of non-biological origin and recycled carbon fuels is set at 94 [gCO2-eq/MJ] and the minimum greenhouse gas emission savings threshold is 70 % for a fuel to qualify as renewable. This means that the greenhouse gas emissions threshold for hydrogen to qualify as renewable is 3.38 [kgCO2-eq/kgH2], assuming a 120 [MJ/kgH2] hydrogen specific energy. In the present study, emissions from transport and distribution of hydrogen are neglected. The electrolyser’s efficiency is assumed to be 50 [kWh/kgH2], producing hydrogen with a purity of 99.97% at standard atmospheric conditions. This leads to an electricity carbon intensity threshold of 67.6 [gCO2-eq/kWh] for hydrogen produced from it to be fully renewable.
The model assumes that, within a specific time frame defined by temporal correlation criteria (e.g., calendar month or one-hour period), the average carbon intensity of electricity is calculated by aggregating emissions from grid and renewable electricity generation. If this average carbon intensity is below the threshold of 67.6 [gCO2-eq/kWh], hydrogen produced using electricity from the PPA and the renewable portion of grid electricity during that period qualifies as RFNBO.
The carbon intensity of grid electricity is the 2020 country emission intensity of electricity as available in the EU Commission’s Methodology Delegated Act. Unless specified otherwise, our analysis utilizes the emissions factor of the Belgian grid.
In our analysis, the assumption for upstream carbon emissions from electricity generation via solar, offshore, and onshore wind sources is zero, in accordance with the approach described in the Delegated Act.
The RES production profiles used in the study are the ones of renewable production data between 2019 and 2022 in Belgium, sourced from ENTSO-E, unless otherwise indicated.
The hydrogen yield calculations represent the average of yearly averages for the 2019–2022 period, based on the production profiles outlined above.
Renewable electricity shares are based on Eurostat’s 2022 yearly average values for Belgium, France and Germany.
The present analysis assumes continuous operation, using temporal averages rather than batch-specific outputs, and focuses on the case where
The model further requires that the additionality and geographical correlation conditions are met, ensuring that the renewable electricity supplier via the PPA is additional and sourced from a geographically aligned location.
Analysis
A combination of offshore wind and solar production leads to a 94% RFNBO hydrogen production with a renewable power production to electrolyser consumption ratio of 1, while solar is capped at 81% RNFBO hydrogen with a two times larger production to consumption ratio.
The initial phase of the analysis involves examining the influence of different renewable production sources and plant sizes on the proportion of hydrogen production deemed RFNBO. Figure 1, displayed below, illustrates these impacts for each technology, employing a monthly temporal matching and assuming a technology mix with 50% solar production for combined production methods.
The graph indicates that the proportion of renewable hydrogen is heavily influenced by the production-to-consumption ratio, and shows that for most the technologies, there is an optimal point to be found beyond which larger plant sizes do not result in higher shares of renewable hydrogen. For offshore wind, onshore wind, combined solar and offshore wind, combined solar and onshore wind, a 90% RFNBO yield is respectively met at 1.19, 1.16, 0.89 and 0.94 production-to-consumption ratios. Picking the correct technology amongst these can thus lead to a 25% decrease of the production to consumption ratio required to reach a 90% RFNBO hydrogen production. It can also be observed that solar electricity production yields lower renewable outputs, with an 81% RNFBO hydrogen production obtained at a production to consumption ratio of 2. This is considerably less than the other technologies compared here and is due to its more concentrated production profile. At low production-to-consumption ratios, however, this more concentrated profile proves to be advantageous. This is demonstrated by solar achieving the highest RFNBO yield until the production-to-consumption ratio gets past a value of about 0.6. It is worth emphasizing that both combined profiles have been observed to attain superior ratios of renewable hydrogen production while maintaining lower consumption to production ratios. This is a consequence of the synergistic effect between wind and solar electricity production that will be studied more in depth further in the analysis.
Optimizing the ratio of solar production in the case of combined generation can lead to RNFBO hydrogen yield relative increases of up to 35% for offshore wind and 45% for onshore wind compared to offshore or onshore wind only scenarios.
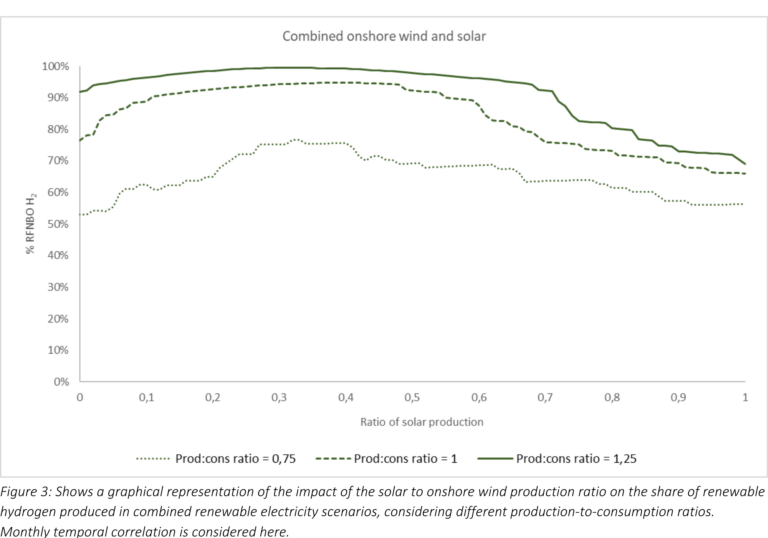
It is worth analysing how the proportion between production methods, in cases of combined generation, affects the share of renewable hydrogen. Figure 2 and Figure 3 depict the relationship between the renewable hydrogen share and the solar production ratio, under various renewable production-to-electrolyser consumption ratios.
These two charts reaffirm the findings observed in Figure 1,underscoring the presence of a synergistic effect between various technologies in combined renewable generation scenarios. The analysis shows that using the correct ratio of solar production in the combined scenarios leads to an RFNBO hydrogen yield relative increases by up to 35% with offshore wind and 45% with onshore wind, relative to scenarios where only offshore or onshore wind is utilized.
The analysis also shows that for both combined sourcing profiles, it is possible to minimize the production-to-consumption ratio by optimizing the solar production in the technology mix of the PPA. This finding is crucial for those aiming to optimize their production of renewable hydrogen, highlighting the value of conducting thorough analyses.
The yield of RNFBO hydrogen production from renewable energy sources and grid electricity varies markedly based on the country of production, with a relative yield increase of up to 48% when comparing solar production under Germany’s high and France’s low grid emissions factors.
As detailed in the assumptions section, the calculation of average electricity emissions accounts for emissions from both grid electricity and production through PPA. Consequently, the grid emissions factor in the country or bidding zone where hydrogen production occurs directly influences the share of renewable hydrogen produced. Additionally, the quantity of RFNBO hydrogen generated depends on the amount of renewable electricity used for its production, including both grid electricity and PPA sources. This results in RFNBO yields being specific to each country. Figure 4 illustrates RFNBO yields by country of production and renewable power generation technology, using a renewable electricity production-to-electrolyser consumption ratio of 1. In combined scenarios, the technology mix assumes 50% solar production.
This portion of the analysis underscores the importance of tailoring the sizing of renewable production installations based on the country or bidding zone. It also reaffirms that renewable hydrogen producers in regions with higher grid emissions factors will need larger renewable electricity production facilities compared to those located in areas with lower grid emissions factors. Solar, onshore wind and combined solar and onshore wind respectively show an RNFBO hydrogen yield relative increase of 48, 50 and 17% when comparing production under France’s low and Germany’s high grid emissions factors with the current assumptions.
The transition from monthly to hourly temporal correlation criteria, scheduled for 2030, is expected to notably decrease renewable hydrogen production yields and modify the optimal sizing of renewable assets, with the example of the RFNBO yield of combined offshore and solar diminishing from 94% to 59% at the production-to-consumption ratio of 1 discussed above.
Up to this point, our analysis has relied on a monthly temporal correlation. However, starting in 2030, a new EU requirement mandates hourly correlation between renewable electricity production and consumption for hydrogen production. In light of this shift, an updated version of Figure 1 is presented below, incorporating the new hourly temporal correlation criteria.
Figure 5 emphasizes that the change from hourly to monthly temporal correlation significantly influences yields and saturation points observed in Figure 1 (showing the effects of the renewable electricity production to electrolyser consumption ratio on the RFNBO produced following the monthly correlation). This underscores the critical importance of considering this transition when determining asset sizes and entering into long-term power purchase agreements (PPAs). Two main observations can be made: yields at low production to consumption ratios are set to increase with the transition. Yields at previously discussed monthly saturation points will decrease. Looking back the production-to-consumption ratios of 1.19, 1.16, 0.89 and 0.94 – previously mentioned as necessary to achieve a 90% RFNBO yield under monthly temporal correlation for offshore wind, onshore wind, combined solar and offshore wind, and combined solar and onshore wind, respectively – we observe that the RFNBO hydrogen production yields decrease from 90% to 55%, 56%, 55%, and 53%, respectively, when an hourly temporal correlation is considered. At the production to consumption ratio of 2 studied earlier, solar production yields 41% of RFNBO, which is a 49% relative decrease from the yield observed in the case of monthly temporal correlation. This analysis brings to light the increasing significance of adopting the appropriate sourcing strategy in response to these changes.
A similar insight is evident from Figure 6 and Figure 7, provided below, which represent the hourly temporal correlation counterparts of Figure 3 and Figure 2 respectively.These charts further emphasize the significance of adapting to the new temporal correlation criteria and taking it into account when optimizing renewable assets sizing.
Conclusions
In light of the European Union’s commitment to a sustainable energy transition, the regulation introduced in February 2023, amending Directive (EU) 2018/2001, represents a pivotal change in energy policy. These stringent guidelines for renewable hydrogen production (RFNBO) enforce renewable and low-carbon standards through additionality, geographical, and temporal correlation.
Our analysis has shed light on several key factors influencing the production of renewable hydrogen and the optimal sizing of renewable assets, each of which plays a vital role in achieving RFNBO status:
Importance of technology choice in PPA: Our investigation has revealed that picking the right production source amongst onshore wind, offshore wind and combinations of solar and offshore or onshore wind can lead to a 25% decrease of the production to consumption ratio required to reach a 90% RFNBO hydrogen production. It has also been observed that solar electricity production alone has a much lower yield, with an 81% RNFBO hydrogen production achieved at a 2:1 production to consumption.
Value of solar production in technology mix: The analysis has shown that the share between production methods in combined generation scenarios significantly affects the share of RFNBO hydrogen produced. Optimizing the ratio of solar production in the case of combined generation can lead to RNFBO hydrogen yield relative increases of up to 35% for offshore wind and 45% for onshore wind compared to offshore or onshore wind only scenarios.
Relevance of location: Solar, onshore wind and combined onshore wind and solar respectively show an RNFBO hydrogen yield increase of 48, 50 and 17% when comparing production under France’s low and Germany’s high grid emissions factors. This underscores the importance of tailoring the sizing of renewable production installations based on the country or bidding zone of the hydrogen production assets.
Impact of transition to hourly temporal correlation: Looking ahead to 2030, the shift from monthly to hourly temporal correlation criteria is expected to significantly impact renewable hydrogen production and asset sizing. At given production-to-consumption ratios, RFNBO hydrogen yields that reach 90% under a monthly temporal correlation drop to approximately 55% when evaluated with hourly correlation. However, yields at lower ratios are projected to increase. This study underscores the importance of careful planning in sizing renewable assets and structuring long-term power purchase agreements, given the important impact that the transition will have on yields and optimal production-to-consumption ratios.
In conclusion, our analysis presents a broad overview of the challenges and opportunities associated with attaining RFNBO status for renewable hydrogen production. While it outlines key trends and considerations, it is important to recognize that this serves as a general guide. For nuanced and effective decision-making, a more tailored approach is necessary, and this is precisely where irex Consulting can provide support. Our expertise in the field enables us to offer detailed analyses that cater specifically to the unique needs of every decision-maker.
Disclaimer: Future yields are also expected to be influenced by the evolution of grid emissions and the increasing penetration of renewables in the energy mix. Additionally, this study is based on average production profiles at the country level rather than specific assets, which may lead to improved yields in practice. Furthermore, the analysis does not account for the potential flexibility of assets, which could further optimize yields and production-to-consumption ratios.
Optimizing RFNBO Hydrogen yields irex Consulting > Energy > Optimizing RFNBO Hydrogen yields The European Union's adoption of renewable hydrogen, key to its sustainable energy transition, marks a pivotal change ...
irex Consulting > Energy > Streamlining Lead-to-Cash Processes through CRM Transformation Streamlining Lead-to-Cash Processes through CRM Transformation CRM Tool Study for Needs Assessment and Vendor Selection in utility commodity supply ...
Enabling PV investment decision through PPA sizing and pricing Facing substantial energy cost increases during the energy crisis, the customer, a large industrial limestone producer with significant power consumption, considered ...
Valuation of Hydrogen Offtake Market Our client is a key player in renewable energy activities with sound development ambitions in the emerging market of sustainable hydrogen in Europe. Operating across ...
Boosting Growth While Cutting Costs A Case Study in Operational Excellence In a very competitive market, our client was able to realize exponential growth through high-quality tailored service offerings and ...
Implementing new capacity mechanisms to comply with EU regulations Our client is a European Transmission System Operator (TSO). The Network Code on Capacity Allocation Mechanism, a.k.a CAM NC aims to ...
Engineering an Energy plan for an industrial manufacturer Founded as a family company in the late 19th century, this Belgian dairy manufacturer has proudly managed to maintain the use of ...
Engaging market challenges to improve growth and ensure profitability In recent years the B2B energy market underwent a dramatic increase in competition. The European energy liberalization lowered entry barriers and ...
Building a Decision-Model for revenue diversification This leading European Gas Transmission Grid Operator has over a 1000 employees across several nations and an +500M€ EBITDA. It operates one of the ...
Analyzing and Developing direct sourcing on the wholesale market for a large consumer Our client is a large retail player in Belgium. Its company culture has a heavy focus on ...
Investment analysis on combined heat and power generation for an industrial site Our client, founded in the early 80’ies as a family company, has maintained the same key values of ...
Re-engineering revenue-critical processes to increase margins and reduce financial risks irex Consulting > Energy > Re-engineering revenue-critical processes to increase margins and reduce financial risks Presenting a lean and dynamic attitude, this energy supplier ...
Share Reducing costs, Mitigating risks and Building capabilities Presenting a lean and dynamic attitude, this energy supplier on the Belgian and French markets grew rapidly since its foundation in ...
Operational analysis and rectification process re-engineering This Dutch Utility has supply, distribution, installation and renewable energy production activities in the Benelux, France and the United Kingdom. In Belgium, the company ...
Adapting Process in a changing Energy Landscape The utility market implementation guide (UMIG) details the processes and related information exchange between parties in the liberalized energy market. Since 2011, its ...
Our Risk Management Methodology Most low-margin businesses with a high amount of their costs related to commodity sourcing are very aware of this. Geopolitically challenged periods often lead to volatile markets, within ...